Understanding Electrical Parameters at STC
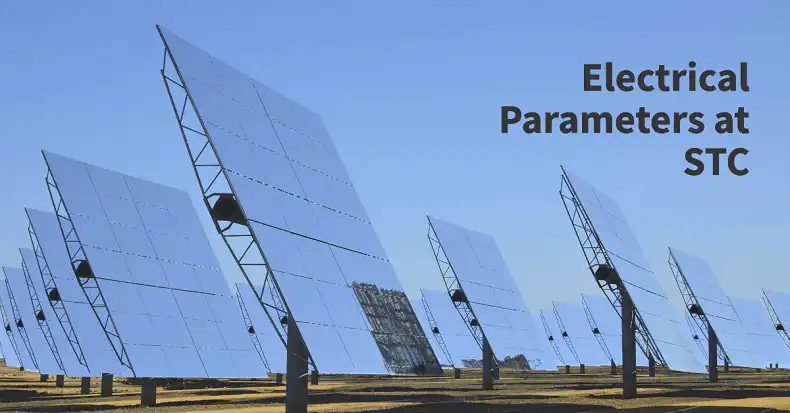
The world of solar energy is vast and complex, with numerous factors influencing the performance of photovoltaic systems. At the heart of this complexity lie the electrical parameters measured at Standard Test Conditions (STC), a set of standardized metrics that serve as the foundation for comparing and evaluating solar panels. These parameters are crucial for solar professionals, enthusiasts, and researchers alike, providing a common language to discuss and analyze solar panel performance.
What Are the Electrical Parameters at STC
When we talk about electrical parameters at STC, we’re referring to a specific set of measurements taken under carefully controlled conditions. Imagine a perfectly sunny day, with the sun high in the sky and a gentle breeze keeping the air crisp and cool. This idealized scenario is what STC aims to replicate in a laboratory setting.
Specifically, STC mandates an irradiance of 1000 watts per square meter, a cell temperature of 25 degrees Celsius, and an air mass of 1.5. These conditions create a level playing field for testing solar panels, ensuring that comparisons between different models and manufacturers are fair and meaningful.
What Electrical Parameters are Measured at STC
At the core of STC measurements are several key electrical parameters. Let’s explain.
Voc & Isc
The open-circuit voltage (Voc) represents the maximum voltage a solar panel can produce when no current is flowing. It’s like the potential energy of a boulder perched atop a hill – full of possibility, but not yet in motion.
On the other hand, the short-circuit current (Isc) is the maximum current the panel can generate when the voltage across it is zero, akin to a river in full flow.
Maximum Power Point
Between Voc & Isc lies the sweet spot known as the maximum power point, where the panel operates at peak efficiency. This point is characterized by the maximum power point voltage (Vmpp) and current (Impp), which together determine the maximum power (Pmax) output of the panel. The relationship between these parameters is often visualized as an I-V curve, a graceful arc that tells the story of a panel’s performance across different operating conditions.
Fill Factor
Another critical parameter is the fill factor (FF), a measure of the panel’s quality. It’s calculated by comparing the actual maximum power to the theoretical maximum power if the panel could maintain its Voc and Isc simultaneously. A high fill factor, typically above 0.7 for modern silicon solar cells, indicates a well-designed panel that efficiently converts sunlight into electricity.
Overall Efficiency
Lastly, we have the overall efficiency, perhaps the most widely recognized parameter. This percentage tells us how much of the incoming sunlight the panel can convert into usable electricity. While laboratory prototypes have achieved efficiencies over 26%, most commercial panels fall in the range of 15% to 22%.
How Solar Panels Are Evaluated with STC Standards
Measuring these parameters requires specialized equipment and a controlled environment that can accurately simulate STC. Here’s how it is done:
The process begins by placing the solar panel in a temperature-controlled chamber. Once the panel reaches the specified 25°C, the light source is activated to provide the exact 1000 W/m² irradiance. The testing equipment then varies the electrical load on the panel, measuring the current at each voltage point. This data is used to plot the I-V curve and calculate all the relevant parameters.
Accuracy is paramount in this process. Even a small calibration error can lead to significant discrepancies in power ratings. For instance, a mere 1% error in irradiance measurement can result in a 1% error in the power rating, which could mean a difference of 3 watts for our 300-watt panel example.
STC Vs Real-World Performance
While STC provides a valuable benchmark, it’s essential to understand that real-world conditions often deviate significantly from these idealized parameters. Actual sunlight intensity varies throughout the day and year, temperatures fluctuate, and environmental factors like dust and shading come into play. This is where Nominal Operating Cell Temperature (NOCT) ratings become valuable.
NOCT conditions attempt to simulate a more realistic scenario, with an irradiance of 800 W/m², an ambient temperature of 20°C, and a wind speed of 1 m/s. These conditions typically result in cell temperatures around 45°C, much closer to what panels experience in the field. NOCT ratings generally show lower power output compared to STC, often 10-20% less, providing a more conservative estimate of real-world performance.
Here’s a comparison table of STC and NOCT ratings for a typical 300W solar panel:
| Parameter | STC Rating | NOCT Rating |
| Power (Pmax) | 300W | 225W |
| Voltage at Pmax (Vmpp) | 32.6V | 30.2V |
| Current at Pmax (Impp) | 9.2A | 7.45A |
| Open Circuit Voltage (Voc) | 39.8V | 37.1V |
| Short Circuit Current (Isc) | 9.8A | 7.94A |
| Module Efficiency | 18.5% | 13.9% |
| Cell Temperature | 25°C | 45°C |
| Irradiance | 1000 W/m² | 800 W/m² |
This table illustrates how panel performance typically decreases under NOCT conditions compared to STC. The power output drops by about 25%, mainly due to higher cell temperature and lower irradiance.
How These Understandings Come into Play When Designing Solar System
Understanding STC parameters is crucial for effective solar system design. When selecting panels, engineers must consider not just the power rating, but also how voltage and current characteristics align with inverter specifications. For instance, the inverter’s maximum input voltage must exceed the panel string’s open-circuit voltage at the lowest expected temperature to prevent damage during cold mornings.
Similarly, the inverter’s Maximum Power Point Tracking (MPPT) range should encompass the panel string’s Vmpp across expected temperature ranges. This ensures the system can operate efficiently under varying conditions. Many designers aim to size the inverter capacity at 100-120% of the panel array’s STC power rating, balancing performance and cost.

![Can You Put Solar Panels on a Townhouse? [Answerd]](https://www.itekenergy.com/wp-content/uploads/2024/04/Can-You-Put-Solar-Panels-on-a-Townhouse-768x428.jpg)
![[Explored] Can You Short Out a Solar Panel?](https://www.itekenergy.com/wp-content/uploads/2023/07/Can-You-Short-Out-a-Solar-Panel-768x428.webp)
